

The most dangerous state for a business system is not necessarily “a bit slow.” Far more serious is when it gradually gets slower, then starts timing out, and finally collapses completely during a business peak. That is exactly what happened in this case.
When the system first launched, average response time was around 2 seconds. It was not fast, but still acceptable for daily use. As the business ran, data grew, and new features continued to be released, the system gradually slowed down. At the time the team was still in rapid iteration mode, so feature delivery always took priority over performance work. Until a few days ago, a database connection pool avalanche brought the entire business system to a complete halt. New requests could no longer be processed; the only way to restore service was to manually restart the backend. The problem did not disappear. Roughly two days later, the same failure occurred again. In the following days the system remained stuck in a state of 5-second-plus responses, frequent timeouts, instability, and occasional further crashes. Customers began complaining continuously, and internal staff could no longer reliably complete their daily work.
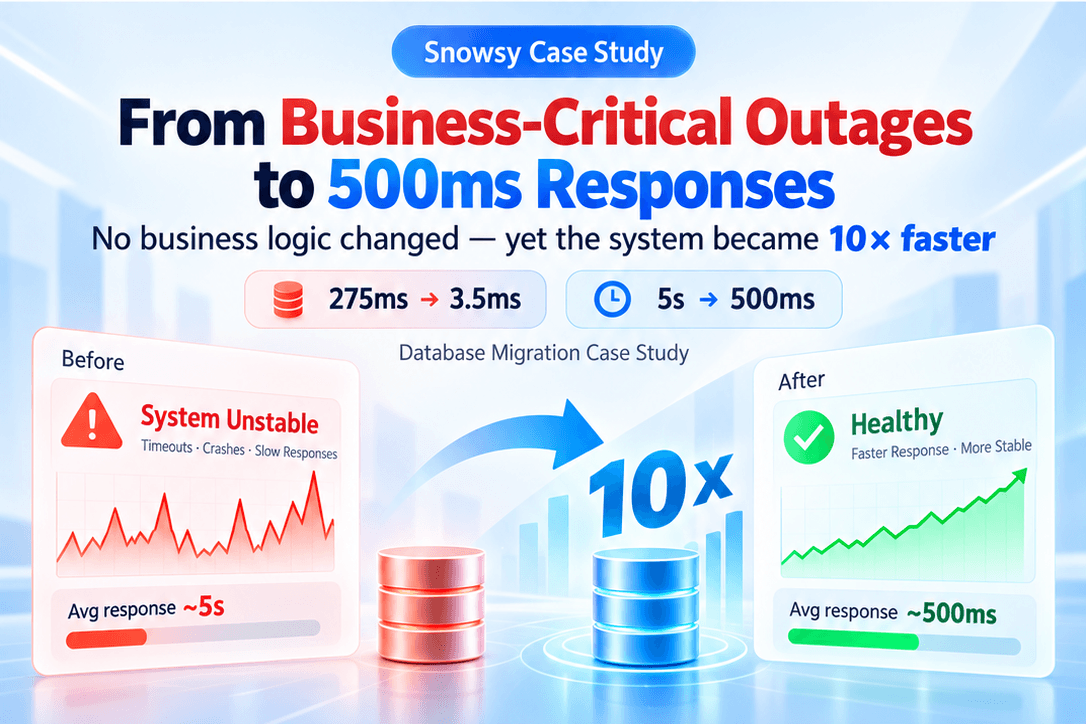
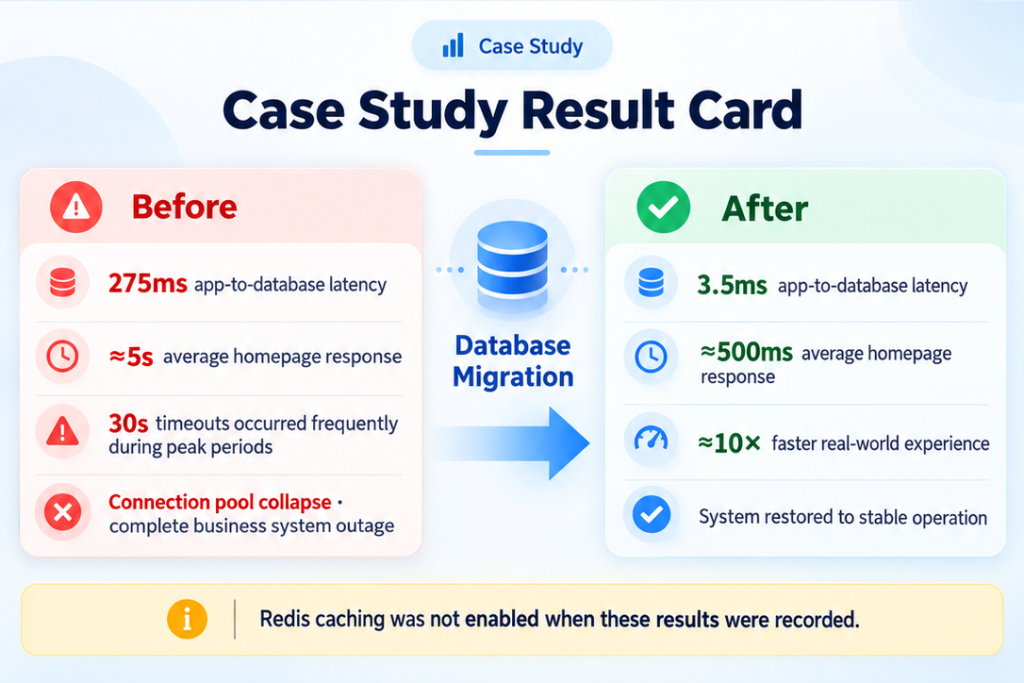
Snowsy then conducted a full technical investigation and identified a critical issue: the application servers were located in Australia while the database was deployed in Singapore. After the database migration, average latency from application servers to the database dropped from approximately 275 ms to 3.5 ms, and average homepage response time fell from around 5 seconds to about 500 ms. Real-world user experience improved by roughly 10×. More importantly, Redis caching had not yet been enabled when these results were recorded. This means the gains in performance and stability came first from correcting the underlying infrastructure problem itself, not from masking it with cache.
At Launch: A Bit Slow, but Not Yet Business-Critical
When the system first went live, it was already not particularly fast. Average response times for the homepage and main business pages hovered around 2 seconds. For an internal system used repeatedly every day, this was far from ideal, yet it had not reached the point of preventing staff from doing their work.
At the same time the project was still in rapid iteration. New business features needed to be shipped, existing workflows required adjustment, and staff kept raising new requirements. Compared with work that directly advanced the business, “pages are a second or two slow” naturally fell down the priority list. This is a realistic allocation of limited resources. For a small company it is impossible to optimise every issue at once. As long as the system was still running, teams usually prioritise features that deliver visible business value right now.
In hindsight, however, the first warning was already present: the system was still usable, but performance problems were accumulating.
Two Months Later: Getting Slower, Yet Features Kept Being Added
As the system continued to run, business data kept growing and staff usage frequency increased. The most obvious change was that pages became progressively slower. What used to require only a short wait later began to show clear pauses on certain screens. The system had not yet spun completely out of control, but staff could already feel it was different from launch day.
The problem was that most of the time it still “worked.” Pages were slower, but they eventually opened; occasional freezes could be fixed by a refresh. As a result, performance issues continued to lose out to feature development.
| Issue at the Time | Actual Priority |
|---|---|
| Unfinished new features | High |
| Business processes needing adjustment | High |
| New requests from staff | High |
| Pages getting slower | Medium–Low |
| Occasional need to refresh or retry | Medium–Low |
In the short term this ordering is understandable. But the system did not stop deteriorating simply because performance was temporarily deprioritised.
Turning Point: Database Connection Pool Avalanche – Complete Business Outage
The real turning point occurred a few days earlier. During a business peak the system began to show severe anomalies. Requests first became slower and slower, then large numbers of them failed to complete. Eventually the database connection pool avalanched; the backend could no longer obtain usable database connections.
The result was not “some features became slow.” It was a complete business-system outage. Staff could no longer perform normal operations, new requests could not be processed, and the system had lost business availability. The only immediate option was manual intervention and a backend restart. After the restart the system came back online — but only temporarily.
What was truly worrying was that roughly two days later the identical problem recurred. This demonstrated that the issue was not a one-off incident, nor something that could be fixed by “just restarting the server.” The system had entered a clearly unhealthy state. Continuing to handle it with manual restarts would only mean waiting for the next outage.
Key Insight: When a system depends on manual restarts to stay operational and the same class of failure keeps recurring, the business is no longer facing an experience problem — it is facing a business-continuity risk.
After the Failure: The System Was Back, but Remained Slow and Unstable
Once the system was brought back online the problems did not end. In the following days page responses stayed at 5 seconds or higher for extended periods. Some requests timed out; during peaks the 30-second timeout limit was frequently hit. Customers began continuously reporting lag and unusable functionality. Internal staff were equally affected. A system that was supposed to improve work efficiency started slowing down daily operations instead.
Worse, system behaviour became unpredictable. Sometimes a page opened in 5 seconds, sometimes it took more than ten, sometimes it timed out outright, and sometimes an administrator had to intervene manually. This state is highly damaging to a business, because what users find hardest to adapt to is not consistent slowness — it is not knowing whether the next click will succeed.
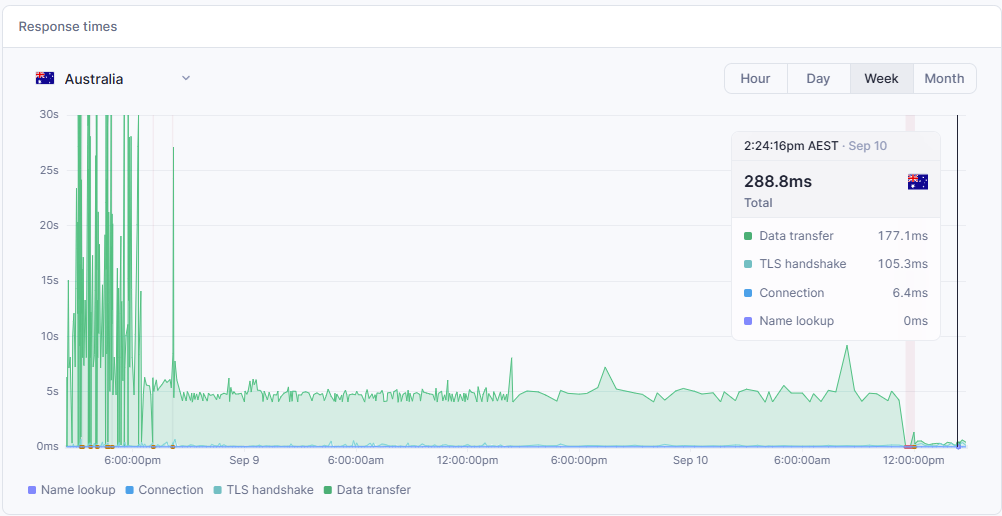
Figure 1: Real monitoring record from system instability and sustained slowness through to completed database migration. The left side corresponds to the unstable period, when database connection resources were exhausted during business peaks, some requests repeatedly hit the 30-second timeout, and the business system eventually went down. After the peak the system resumed operation, but response times remained around 4–5 seconds for an extended period in the middle. The red area on the right marks the planned downtime window for the database migration; once migration finished, response times on the far right dropped markedly.
This chart contains one particularly important piece of information: after the peak ended the system was still slow. In other words, the business peak merely exposed the problem — it was not the problem itself.
Investigation: Why Did Restarting Restore Service, Only for the Same Crash to Recur Two Days Later?
Looking only at the surface of the failure, the most immediate symptom was that the database connection pool was exhausted. That explains why the system went down at the time. It does not explain another fact: why the system only temporarily recovered after a restart and then re-entered the same state two days later.
We therefore did not treat “increasing the connection-pool size” or “continuing to restart services” as the final solution. Instead we began a thorough re-examination of the entire runtime environment. The scope covered application behaviour, database connections, server resources, infrastructure configuration, and the actual communication paths between services. Eventually one anomalous configuration became very clear: the application servers were in Australia while the database was deployed in Singapore.
For non-technical readers this can be understood as follows: every time the application needs to read or write data it must communicate across regions. A single extra wait may not seem significant, yet a typical business page often involves multiple data interactions. When those waits accumulate they translate directly into the multi-second delays users see. When the system enters a business peak and concurrency rises, the extra overhead further amplifies pressure on connection resources.
Actual measurement produced a critical figure: average latency from application servers to the database was approximately 275 ms. This was not necessarily the only problem in the system, but it was clearly a foundational issue worth prioritising.
Approach: Fix the Infrastructure First, Instead of Relying on Restarts
Once the problem was confirmed we scheduled a database migration. The goal was straightforward: place the database and application servers in more appropriate locations so that every data interaction no longer incurred unnecessary extra latency. For a system already running in production this is not a matter of clicking a few buttons. Data integrity, the maintenance window, application configuration, migration verification, rollback procedures, and post-migration business checks all had to be considered. Consequently a planned maintenance window was arranged. The red area on the right of the monitoring chart is precisely that downtime window for the database migration.
At the same time we prepared the codebase for subsequent performance optimisations, including reserving the necessary infrastructure for caching capability. One point must be emphasised: when the performance results in this article were recorded, Redis caching had not yet been formally enabled. In other words, the improvements observed were not the result of cache dramatically reducing real database access. The primary change came from correcting the location of the infrastructure itself.
Results: From Repeated Outages to 3.5 ms and 500 ms
After the migration we re-tested. The results were clear.
| Metric | Before Optimisation | After Optimisation |
|---|---|---|
| App → DB average latency | ≈ 275 ms | ≈ 3.5 ms |
| Homepage average response time | ≈ 5 s | ≈ 500 ms |
| Production status | Connection-pool avalanche, business outage | Clearly recovered |
| Peak behaviour | Frequent 30 s timeouts | Clearly improved |
| Redis cache | Not enabled | Still not enabled |
Average latency between application servers and the database fell from approximately 275 ms to approximately 3.5 ms — a reduction of more than 98 %. For customers and staff the more immediate change was homepage response: from roughly 5 seconds down to roughly 500 ms, or about 10× faster. More importantly, the system no longer depended on “restart when something breaks” to stay operational.
This improvement was not about suppressing a single incident. It was about bringing a production system that had already begun to threaten business continuity back to a controllable, usable state.
What This Case Really Solved Was Not Just “Pages Are Too Slow”
Looking only at the numbers, this appears to be a performance-optimisation case. What it actually resolved was a more serious problem: the business system had started to lose reliability. When a system requires an administrator to restart it manually in order to keep working, and the same class of failure recurs days later, the enterprise is no longer dealing with “poor experience.” It is dealing with business-continuity risk.
Can staff continue to work? Can customers use the system normally? When will the next failure occur? How long will recovery take once something goes wrong? These questions matter far more than “a particular page is a few seconds slow.” We therefore do not summarise this case simply as “database latency was reduced by 271.5 ms.” The more accurate business outcome is: a production system that had repeatedly gone down and was affecting both customers and staff was, after investigation and infrastructure adjustment, restored to a stable, fast, and usable state.
Lesson for Small Businesses: Repeated Restarts Are Not a Solution
Many companies fall into a dangerous operating pattern after a system failure: it breaks → restart → it works → keep using it → it breaks again a few days later → restart again. As long as each restart restores service, it is easy to feel “we can leave this for later.” But when the same failure keeps recurring, it is usually no longer a one-off incident. It is a signal that some foundational part of the system is already unhealthy.
At that point the more important questions are not “how can we restart faster next time,” but: Why does it keep happening? Where is the real bottleneck? Is there a way to fundamentally reduce the probability of another outage? That is the most valuable aspect of this case — not how much technology was used, but starting from a connection-pool avalanche, tracing the root cause all the way to the infrastructure layer, and finally validating the remediation with real data.
Has your system already entered the “restart to stay alive” phase?
Some systems fail dramatically, for example by going completely offline. More often the truly dangerous signals are quieter: pages keep getting slower, staff frequently refresh, customers start complaining, services occasionally need restarting, the same problem reappears a few days later, and after every failure someone has to handle it manually. These symptoms indicate that the system may no longer be merely “a bit old” or “a bit slow.” It has begun to affect business stability.
If your business already depends on an existing system, the first step does not have to be a complete rebuild. A more rational approach is usually to first understand why it is slow, why failures keep recurring, and where the real risks lie.
Snowsy helps small businesses and startup teams inspect and improve systems that are already in production — covering performance, code, databases, deployment, and infrastructure. For systems that have entered day-to-day business use but lack a dedicated long-term technical team, we also provide ongoing system-maintenance support including monitoring, deployment, backups, incident handling, and subsequent performance optimisation.
Snowsy Software
Existing-system optimisation, refactoring, migration and long-term maintenance.
Keeping systems that are already working continue to work reliably for the business.